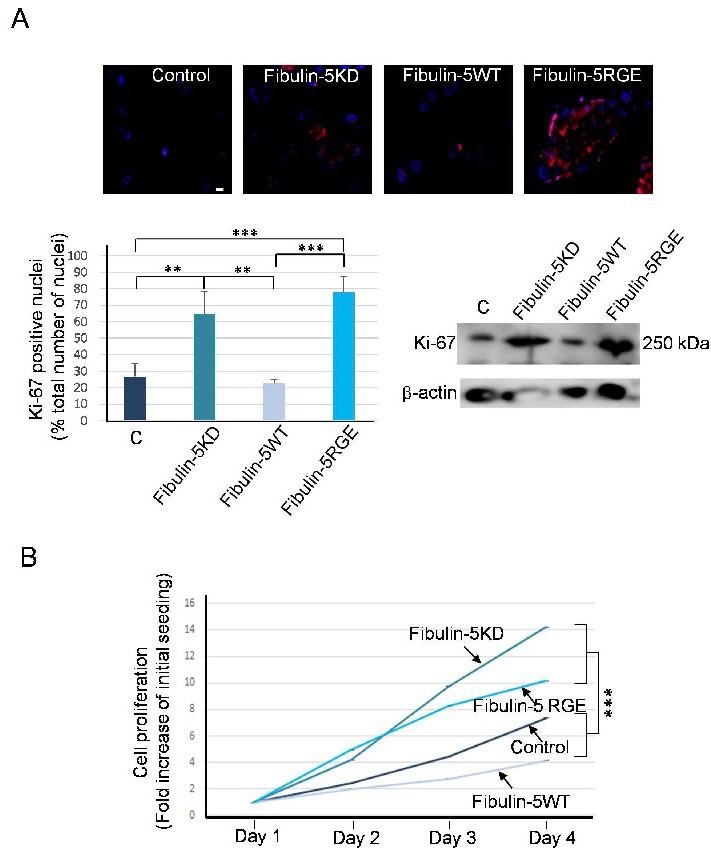
Fig. 2. RGD-to-RGE change in fibulin-5 affects proliferation of 4T1 cells. A. Expression of the proliferative nuclear marker Ki-67 was examined by immunocytochemistry. Top, representative images of Ki-67 staining (in red) in the indicated 4T1 cells. Cell nuclei are shown in blue; bar, 10 µm. Bottom left, quantification of Ki-67 positive nuclei. Bottom right, Western-blot analysis showing Ki-67 expression in the indicated cells. Molecular weight markers are indicated on the right and β-actin was employed as loading control. B. Cell proliferation of the 4T1 cells employed in this work measured by MTT assay.